Coastal Hazards Mapping
Background
Parts of Noosa Shire are affected by coastal hazards. The risks associated with these hazards are projected to increase as a result of sea level rise over time.
While the Queensland Government maps areas likely to be affected by coastal hazards by 2100, their ‘first pass’ assessment mapping does not provide sufficient information regarding likelihood and consequence required for more detailed risk assessments at the local level. It also only provides mapping results for the year 2100, but not the intervening years such as 2040 and 2070.
Council has therefore updated this mapping for our local government area as part of the development of its Coastal Hazards Adaptation Plan (CHAP). This has been done in accordance with the QCoast2100 program and the guidelines and minimum standards set by the State. For more information on the CHAP and the mapping produced here (including the mapping guidelines, standards and mapping methodologies), please visit the CHAP homepage.
The mapping illustrates possible changes in the three coastal hazards listed below. Further details on each hazard are provided in the Map Layers section below.
- Permanent inundation (expanding tidal areas due to sea level rise) – labelled as the ‘Sea Level Rise HAT inundation’ layer
- Coastal erosion (loss of land away from an area of the shore due to storms and/or long-term recession) – labelled as the ‘Erosion Prone Area’ layer
- Storm tide inundation (inundation of land due to the combination of a high tide and storm surge) – labelled as the ‘Storm tide inundation 1% AEP’ layer
The mapping explores changes in these hazards across four planning horizons: current, 2040, 2070 and 2100. Decisions made today will have consequences for many decades in the future with regard to regional planning, land use, infrastructure investments, etc. While for some projects, it is important to consider climate change projections that are relevant late into the century, for others, it may be more appropriate to focus on shorter time horizons such as 2040. Examples are illustrated in the figure below provided by the CSIRO.
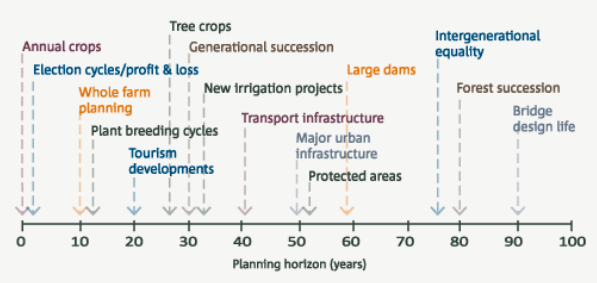
Typical planning horizon from different sectors (CSIRO)
Note that the Queensland Government’s coastal hazard planning currently uses a projected sea level rise figure of 0.8m (or 800mm) for our region for the year 2100. The future climate scenario modelling underpinning this projection is based upon a high greenhouse gas emissions pathway, called ‘RCP 8.5’. This pathway is often referred to as 'business as usual' because up to now, human emissions at the global scale have tracked this pathway most closely. The Queensland Government State Planning Policy mandates the adoption of a projected 0.8m sea level rise to 2100 for coastal hazard assessment in planning and development in the Natural Hazards State Interest Policy. This requirement is mirrored by the QCoast2100 Minimum Standards and Guidelines. Please see Council’s CHAP homepage and associated technical documentation for more information.
Map Layers
The map layers can be viewed here - Coastal Hazard Maps. Click on Noosa Plan 2020, then select the Coastal Hazards map layers. Further instruction on how to access this mapping is also available via the document library provided on the CHAP project page.
Brief details on each layer are provided below. Each map has been generated in accordance with the guidelines and minimum standards set by the State, which are available in the document library along with reports and methodologies used to produce the mapping.
Sea Level Rise HAT Inundation
This layer illustrates the coastal hazard known as permanent tidal inundation, which, put simply, is the expansion of tidal areas due to sea level rise. As sea levels rise, the level of tidal waters increases in elevation in relation to the shoreline, covering low-lying areas with sea water. In practice, this will look like a very significant ‘king tide’, although instead of occurring every so often as occurs with ‘king tides’ today, it has the potential to occur monthly in some locations, to every week in other areas, when the tide peaks.
The inundation extent shown here considers present-day highest astronomical tide (HAT) in addition to an appropriate allowance for sea level rise, across the three future planning periods of 2040, 2070 and 2100.
Erosion Prone Area
This layer illustrates the coastal hazard known as erosion, which can be described as the loss of land away from an area of the shore due to storms and/or long-term recession.
The calculation of erosion shown here for open coast areas considers long-term erosion, short-term erosion (such as that experienced during an extreme storm event, i.e. for Noosa, a 1% Annual Exceedance Probability (AEP)1 wave height and 1% AEP storm tide level), slumping of the eroded dune, recession of the beach under the influence of sea level rise and a 40% factor of safety to account for uncertainty in additional influences (e.g. due to changing wave climates). The mapping covers the four planning periods of present day (Current), 2040, 2070 and 2100.
Note that the potential erosion extents illustrated in the map do not represent ‘erosion cliff faces’. The erosion extents show the potential area that may be subject to erosion within the given time horizon as a result of a major storm event and sea level rise.
Storm Tide Inundation 1% AEP
This map illustrates the coastal hazard known as storm tide inundation, which can be described as the inundation of land due to the combination of a high tide and storm surge. A storm tide occurs when a storm approaches the coast and a storm surge combines with the expected tide to create a storm tide. Because of sea level rise, storm tides will have the ability to push further inland than they currently do, inundating a greater area and affecting more human and ecological systems than before.
The storm tide inundation extent mapped here represents a storm tide event with a 1% AEP1 and is based on a statistical assessment of combined storm surge and astronomical tides. The storm tide mapping includes consideration of sea level rise for the three future nominal planning horizons: 2040, 2070 and 2100.
These maps are a representation of storm tide inundation potential for the modelled flood event. They do not depict complete inundation potential, such as during a more extreme storm event or during a coinciding flood event (i.e. storm tide inundation and catchment flooding peaking at the exact same time). More severe, but less frequent storm tide inundation events may inundate land beyond the areas shown.
1Note that Queensland Government’s technical guidelines recommend the use of the 1% AEP design storm event for consistency for the purpose of updating the State’s erosion prone area mapping. The Annual Exceedance Probability is a statistical measure used to describe the chance of an event of a given magnitude being equalled or exceeded in any one (1) year period. If an event has a 1% AEP, it has a one (1) in one hundred (100) chance of occurring or being exceeded in a given year. Note that while for each and every year, there is a 1% chance that the event will be equaled or exceeded, the event has a higher chance of being equaled or exceeded over a longer period. For example, the 1% AEP event has a 40%, or between a 1 in 2 chance and a 1 in 3 chance, over a 50 year period, and a 50% over a 70 year period. See references from BOM here and the Queensland Chief Scientist here for more information on event probabilities, as well as the image below from this report.
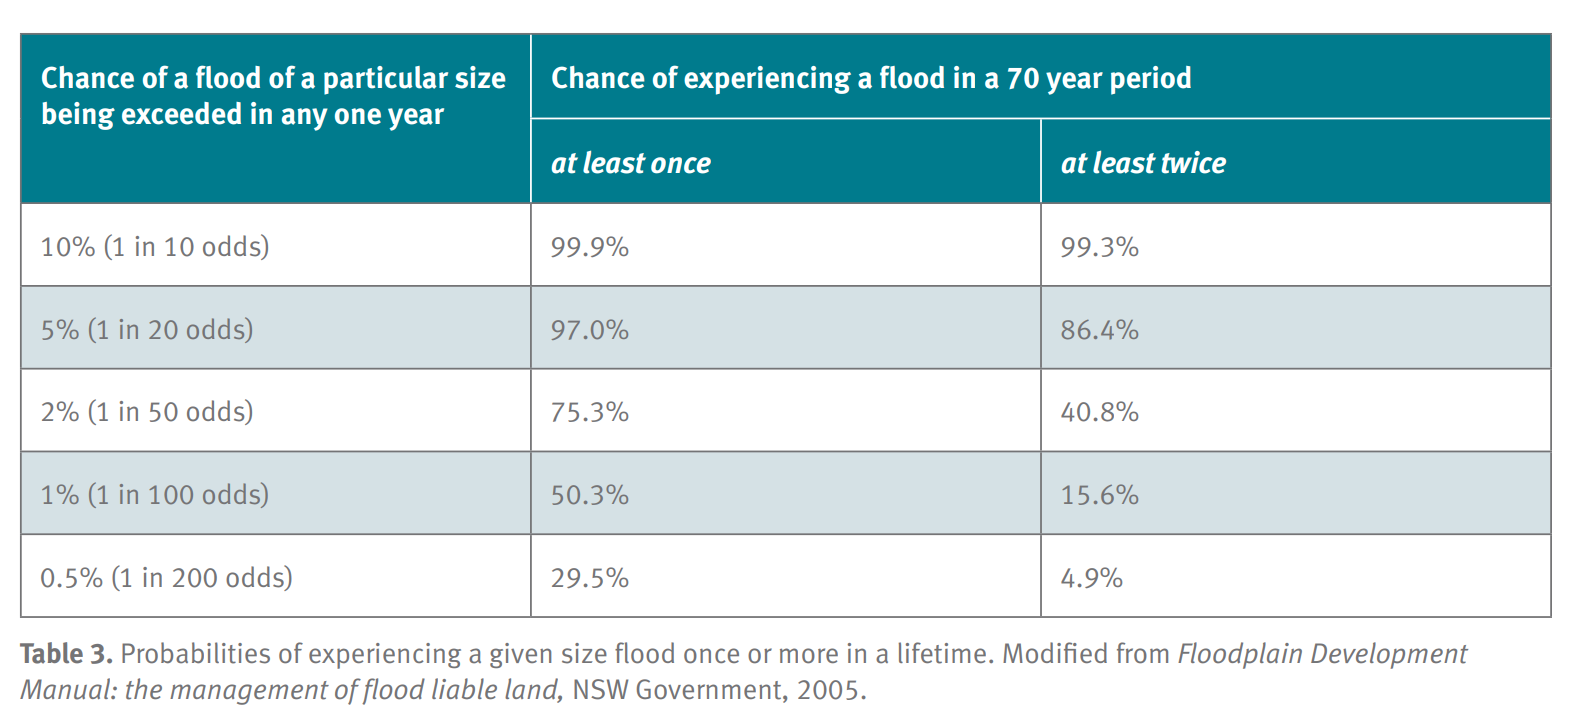
Probabilities of experiencing a given size flood once or more in a lifetime (State of Queensland, 2011)
Disclaimer
Note that this mapping is indicative only and should not be relied upon for making detailed design decisions as part of the development of buildings, infrastructure or other structures at the individual lot scale. The mapping has been prepared in order to assist Council and the community to identify and proactively plan for areas that may be impacted by climate-driven hazards now and in the future.
While Noosa Council has exercised reasonable care in preparing this mapping, Council makes no representations or warranties (expressed or implied) about its accuracy, reliability, completeness, currency, function, capability or suitability for any particular purpose and disclaims all responsibility and all liability (including without limitation, liability in negligence) for all expenses, losses, damages (including indirect or consequential damage) and costs that may occur as a result of the product being inaccurate or incomplete in any way or for any reason.
Further Information
For more information on Council’s coastal hazards planning, including FAQs, mapping guidelines and methodologies, please visit the CHAP project page here.